This update expands on our realtime dashboards and introduces a preview into new functionality on our 2021 roadmap.
New Cisco Unity Connection (CUC) System Health dashlet
We've added another dashlet, for Cisco Unity Connection System Health showing:
- Uptime
- CPU
- Memory
- Network connectivity with drill-down
More functionality is still to come in future releases.
Further enhancements to Ribbon SBC Edge System Health dashlet
The Ribbon SBC Edge dashlet functionality has been extended and now includes:
- Version with informational mouseover
- Licenses
- DSP - with drill down page
- Global Call counters - with drill down page
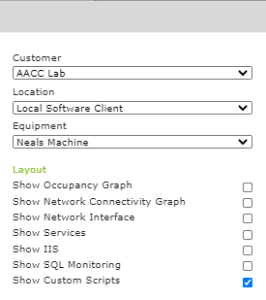
To add additional panels onto existing dashlets, go into the dashlet settings and tick the required panels in Layout.
Further enhancements to VMware System Health dashlet
The VMware System Health dashlet now comes in two sizes, small and large. Changing the dashlet size to large shows an expanded view of the virtual machine system health.
VSM monitors virtual machines and displays information about each VM including;
- Power status
- ESXi host
- Data Center
- OS
- IP address
You'll see this additional information via a mouseover.
Custom Alarming based on powershell commandlet output
We have also introduced the ability to create customized alarms based on power shell scripts on your Windows Servers.
More equipment types will be added during the course of the year.
Note that the custom scripts can be seen on the Windows Server dashlet, once 'Show Customer Scripts' has been selected on the dashlet settings.
Bug Fixes
Previously in Files and Folders, some folders would throw an error when attempting to edit the 'Share' with users section. This has now been corrected.
Some customers experienced an issue where they could not enable the advanced RDP configuration on Windows Servers, this has now been corrected.
Previously when exporting the Backup Summary report to PDF the Date/Time would overlap the headers, this has now been corrected.


